Random seeds on CV
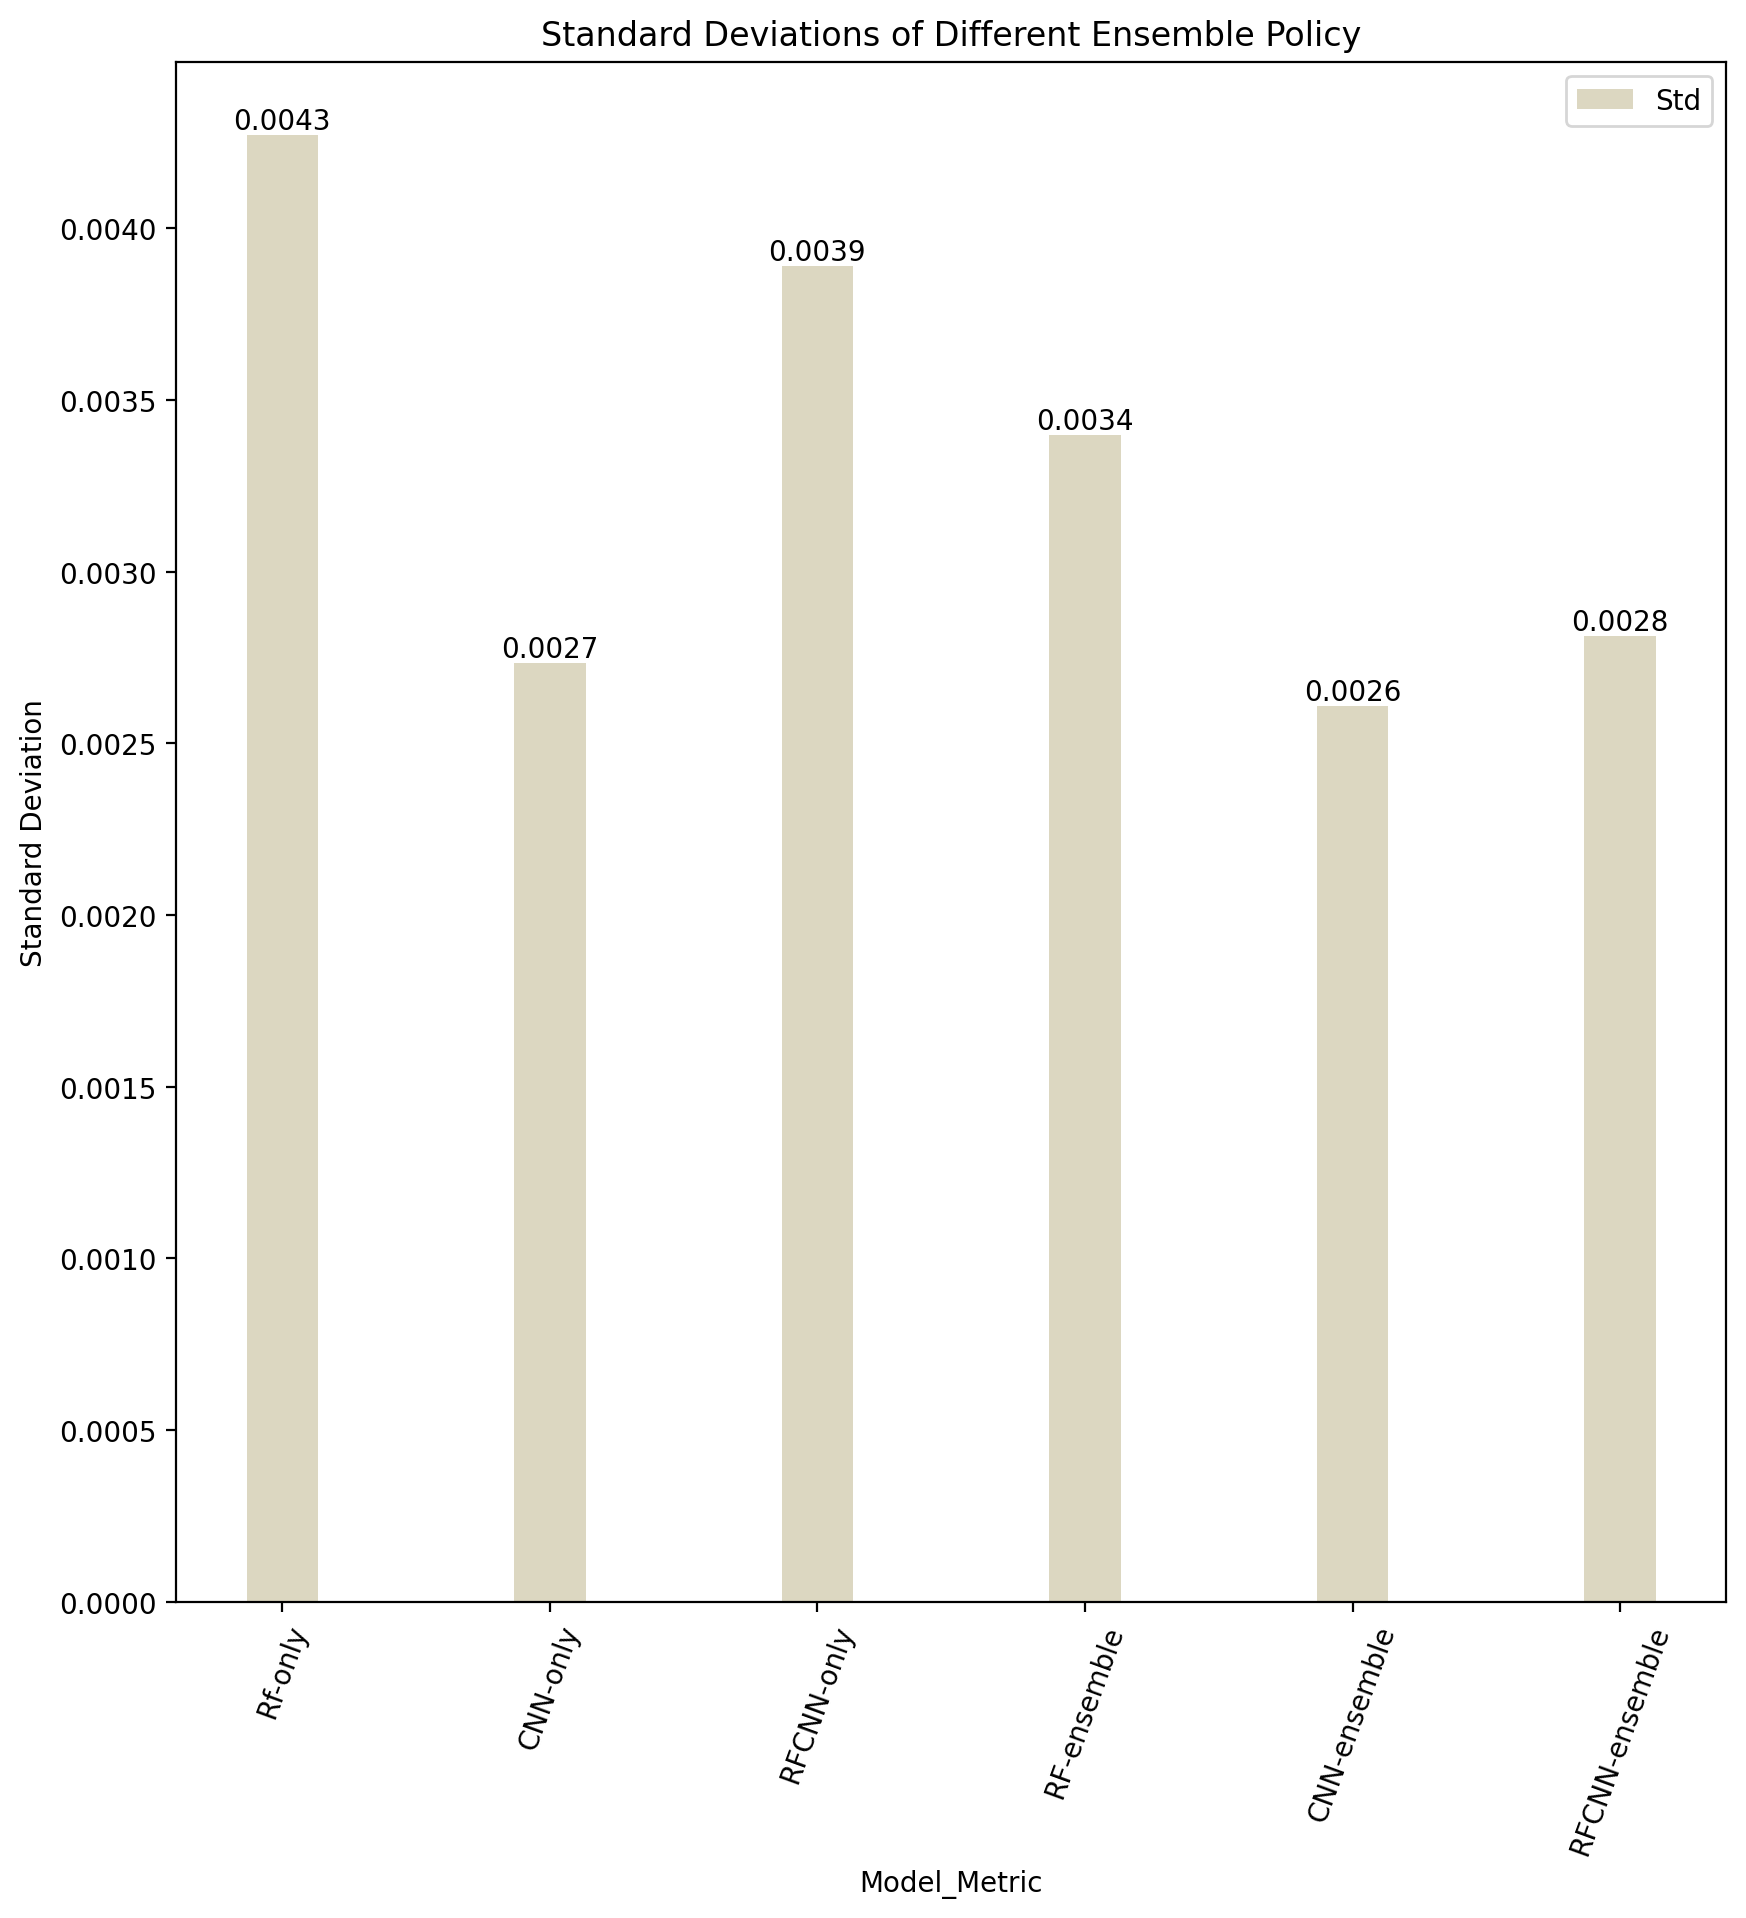
We further conducted experiments on the variables that might contribute to the performance of the models. Those variables include the composition of Datasets (LC, IT, LCIT), random_seeds for the Negative samplings (File_rs), and random seeds for cutting the dataset into five-folds (Divide_rs). We sorted the value of the Standard Deviation of the metrics value of RF/ CNN/ RFCNN and made an illustration as Figure below:

Random Seeds on Ensemble methods
We further conducted experiments concerning ensemble methods. We trained two more models with random seeds 4,5 and then randomly selected three models out of five models, recalculated, and collected the results.
| rs_c | Rf-only | CNN-only | RFCNN-only | RF-ensemble | CNN-ensemble | RFCNN-ensemble | Mean | M_std |
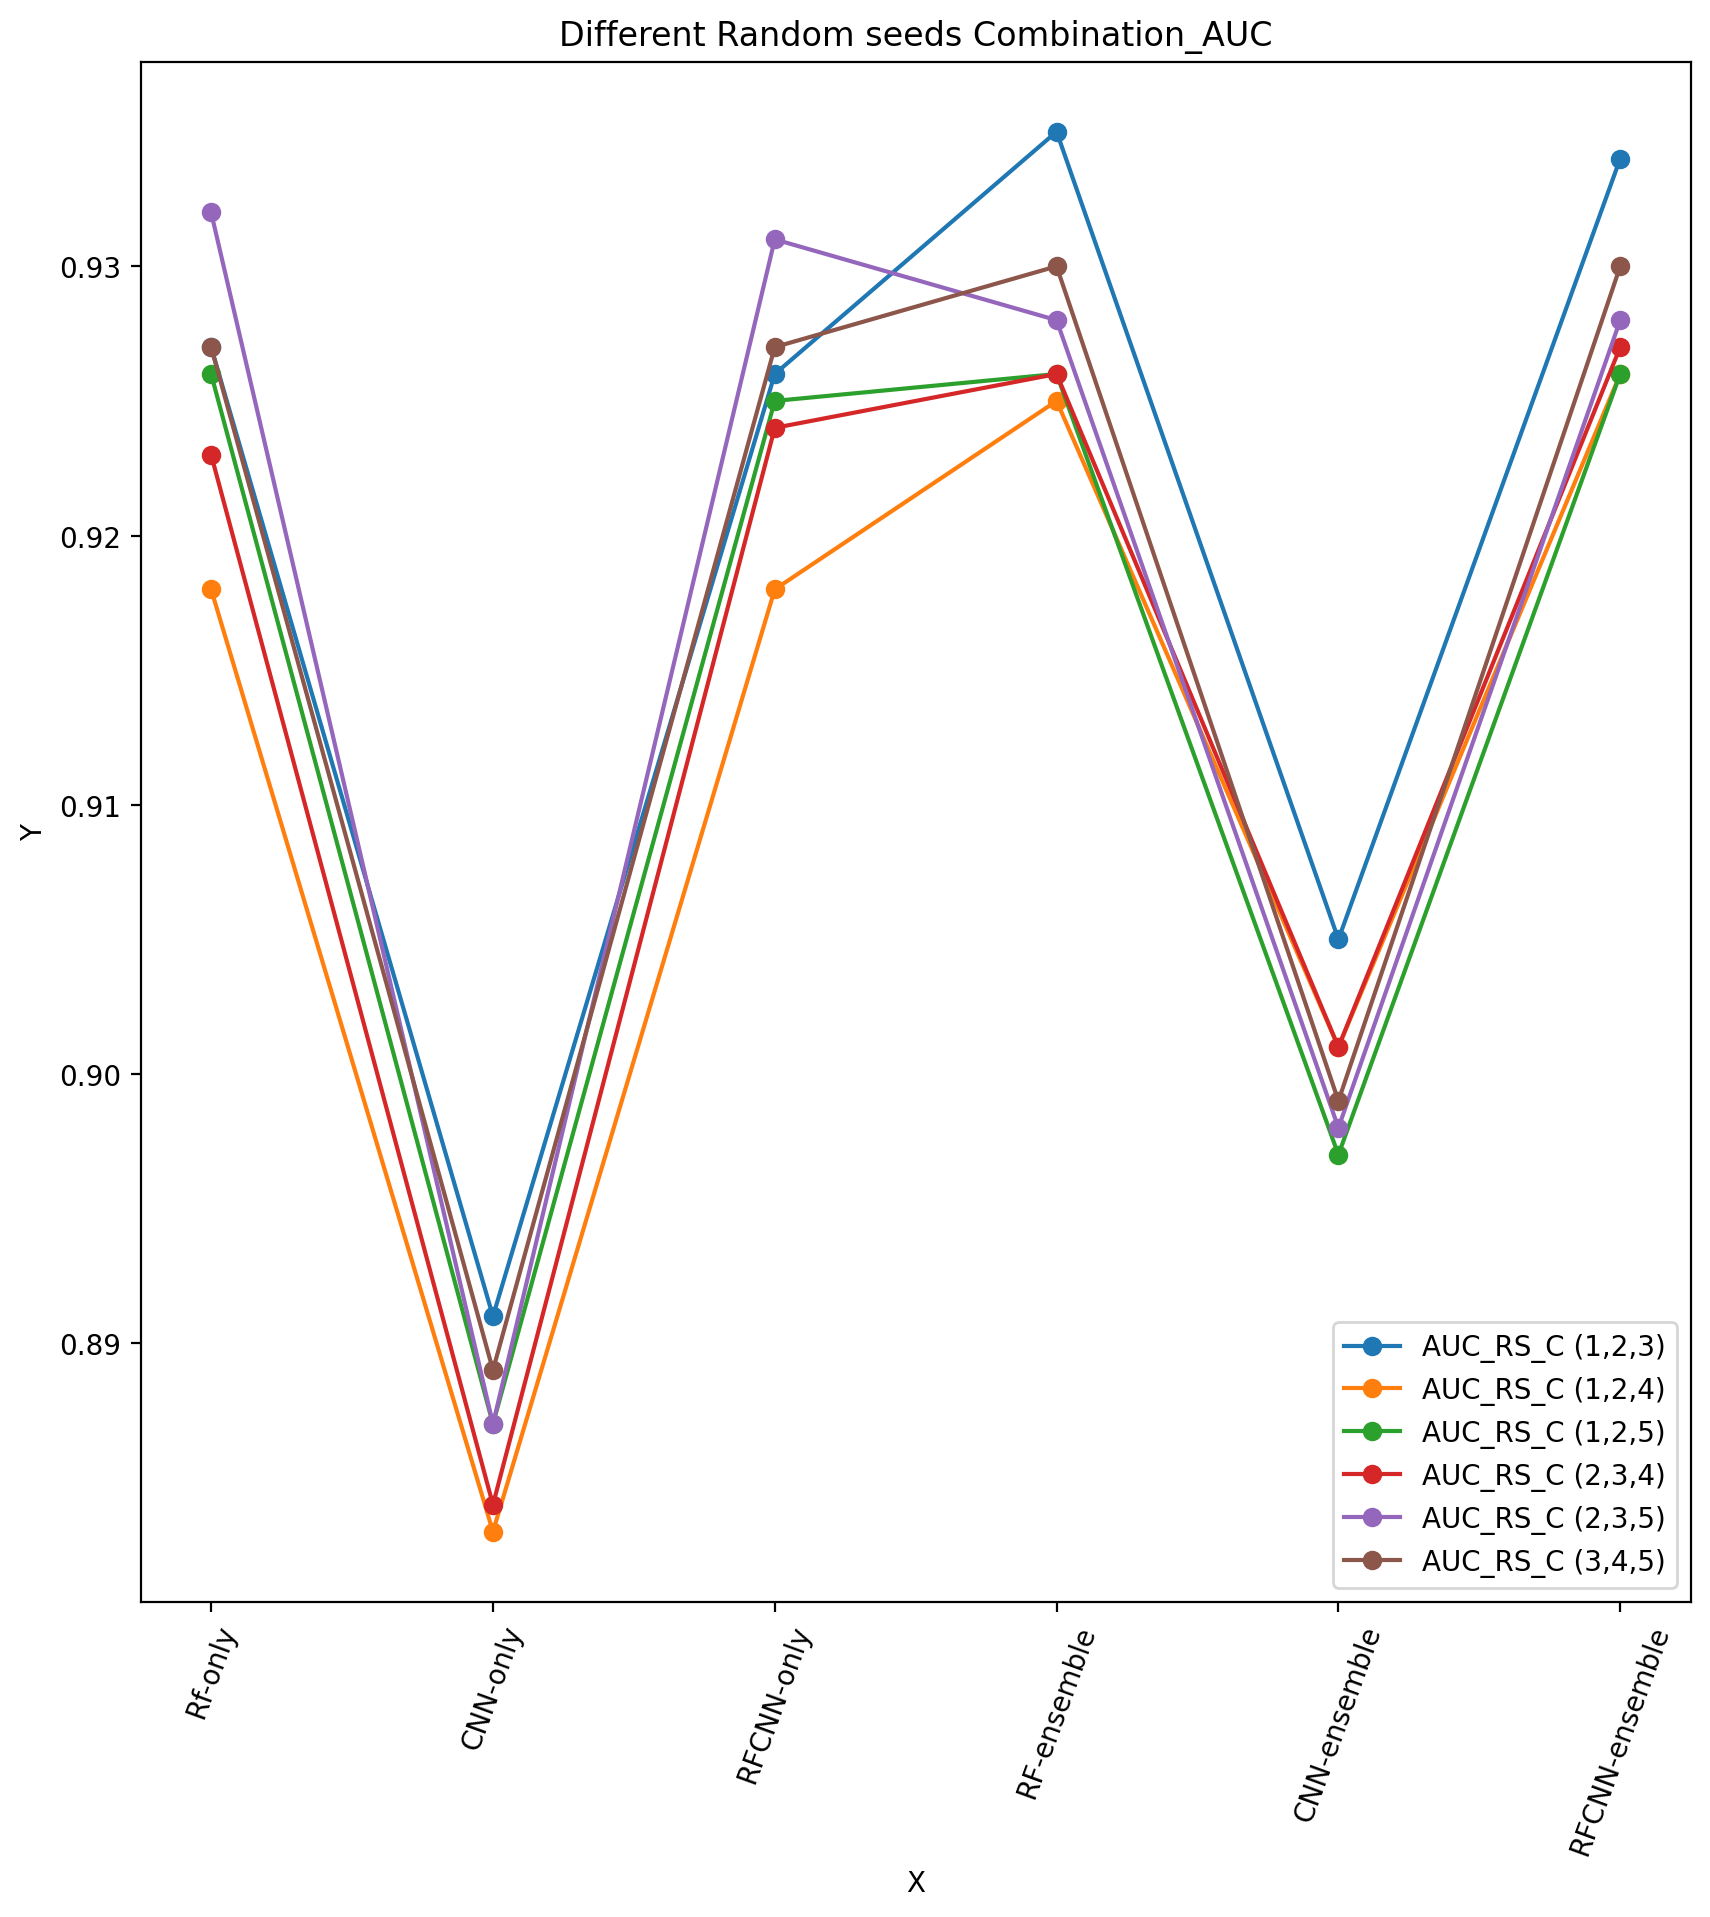
| 1,2,3 | 0.927 | 0.891 | 0.926 | 0.935 | 0.905 | 0.934 | 0.919667 | 0.016183 |
| 1,2,4 | 0.918 | 0.883 | 0.918 | 0.925 | 0.901 | 0.926 | 0.911833 | 0.015269 |
| 1,2,5 | 0.926 | 0.887 | 0.925 | 0.926 | 0.897 | 0.926 | 0.9145 | 0.016174 |
| 2,3,4 | 0.923 | 0.884 | 0.924 | 0.926 | 0.901 | 0.927 | 0.914167 | 0.016139 |
| 2,3,5 | 0.932 | 0.887 | 0.931 | 0.928 | 0.898 | 0.928 | 0.917333 | 0.017904 |
| 3,4,5 | 0.927 | 0.889 | 0.927 | 0.93 | 0.899 | 0.93 | 0.917 | 0.016563 |
| Std | 0.004272 | 0.002734 | 0.003891 | 0.003399 | 0.002609 | 0.002814 | ||
| Mean | 0.9255 | 0.886833 | 0.925167 | 0.928333 | 0.900167 | 0.9285 |
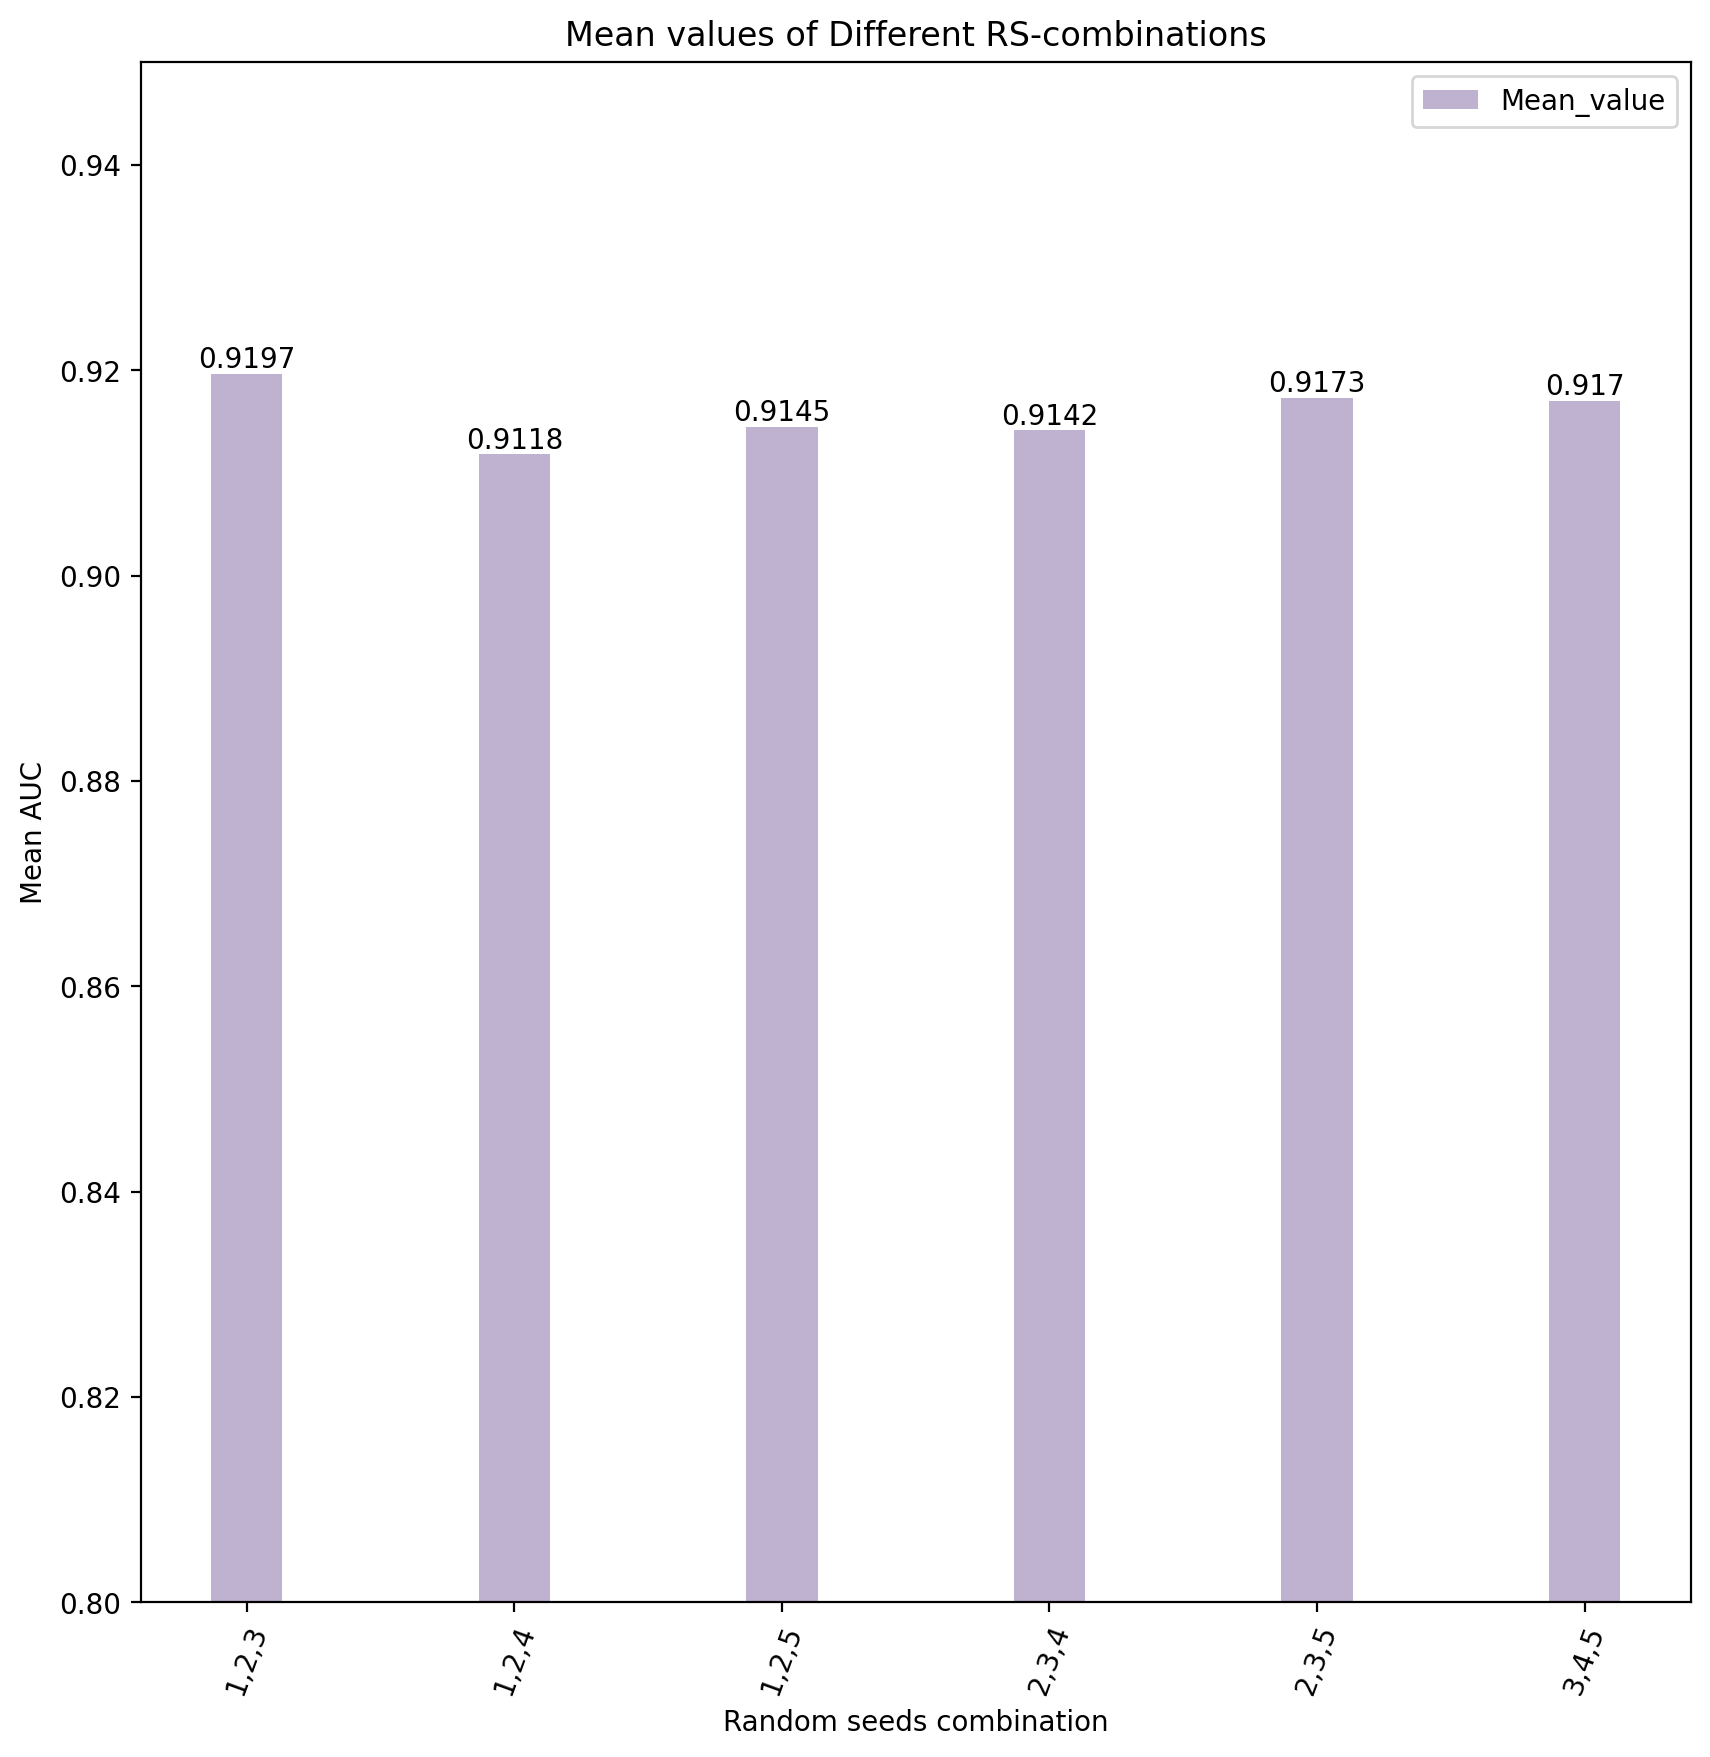
The table shows that the random seed combination 1,2,3 can achieve the highest AUC values in terms of the RC-CNN ensemble model, and they can also achieve the highest mean AUC among other random seed combinations. From the mean values of different ensemble policies, we can also find out that the RF-CNN ensemble can perform slightly better than RF-ensemble.
Here are some visualization of previous Table.


